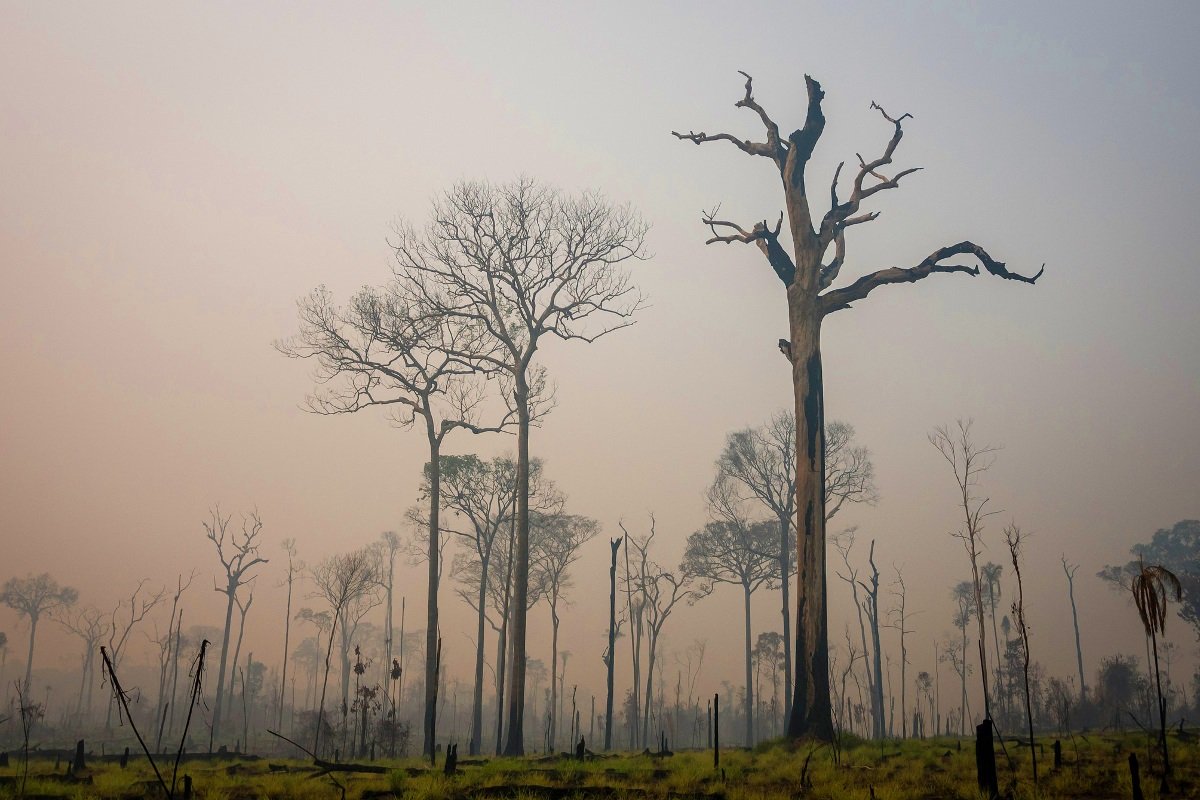
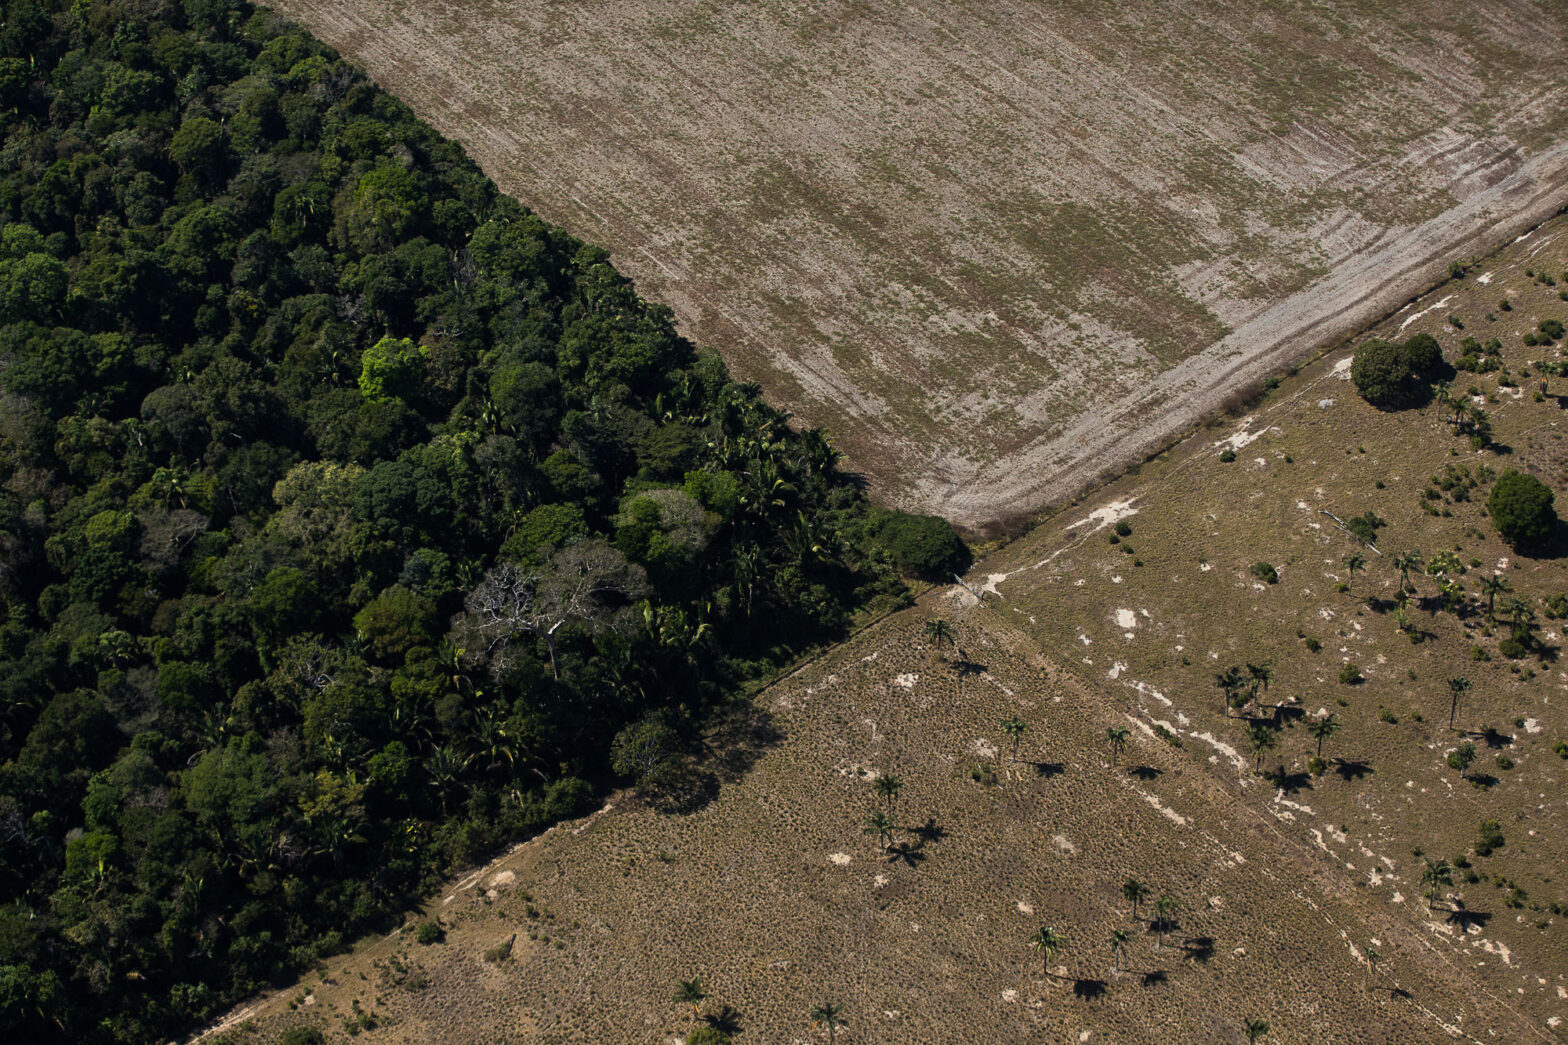
By 2015, deforestation was calculated at 7,930 hectares (equivalent to 10,865 football fields) in the study area. The main driver would be pasture for cattle.
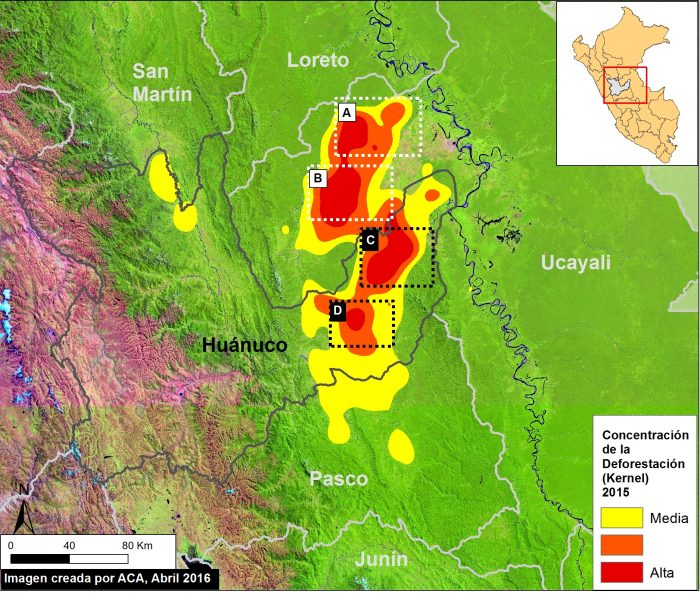
In the previous MAAP #26, we presented a map of Deforestation Hotspots in the Peruvian Amazon during 2015*. This analysis showed that the highest concentration of deforestation is in the central Peruvian Amazon.
Here in MAAP #37, we focus on this region, as indicated by Image 37a. Specifically, we analyze the hotspots shown in Insets C and D, located in the eastern section of the department of Huanuco.
(Note that we previously described the hotspots indicated by Insets A and B, located in northwest Ucayali department, in MAAP #26).
For 2015, we calculated a total deforestation of 7,930 hectares (19,595 acres) in the area indicated by these two insets. The main deforestation driver is likely cattle pasture (see below). It is worth noting that the vast majority of the deforested area (87%) is outside of areas zoned for agriculture use.
We calculated an additional deforestation of 16,590 hectares (41,000 acres) in 2013 and 2014. Again, the vast majority of the forest loss appears to be outside areas zoned for agriculture use.
Deforestation Driver: Cattle Pasture
The predominant land use in the area is cattle pasture, so that is likely the leading driver of the documented deforestation.
We took a sample (1,500 hectares) of areas that were deforested in 2014, and found that 76% (1,140 hectares) were converted to cattle pasture in 2015. All sample areas were greater than 5 hectares and had available high-resolution imagery from September 2015. Based on an analysis of the imagery, we estimate that a similar amount of area was being cleared for pasture in 2015.
Below, we show a series of high-resolution images of this deforestation (click each image to enlarge).
Inset C Hotspot
Image 37b shows a detailed view of the deforestation inside the area indicated by Inset C.
In this area, we documented deforestation of 5,050 hectares in 2015. Of this total, 46% of the deforestation events were small-scale (50 ha).
We calculated an additional deforestation 0f 9,940 hectares in 2013 and 2014.
In Image 37c we show, in high resolution, an example of the recent deforestation in this area between August 2014 (left panel) and September 2015 (right panel). See Inset C1 for context.
Inset D Hotspot
Image 37d shows a detailed view of the deforestation inside the area indicated by Inset D.
In this area, we documented deforestation of 2,883 hectares in 2015. Of this total, 44% of the deforestation events were small-scale (50 ha).
We calculated an additional deforestation of 6,650 hectares in 2013 and 2014.
In Images 37e – 37f, we show, in high resolution, two examples of the recent deforestation in this area between June (left panel) and September (right panel) of 2015. See Insets D1 and D2 for context.
– This report was originally published in MAAB and is republished by an agreement to share content.


