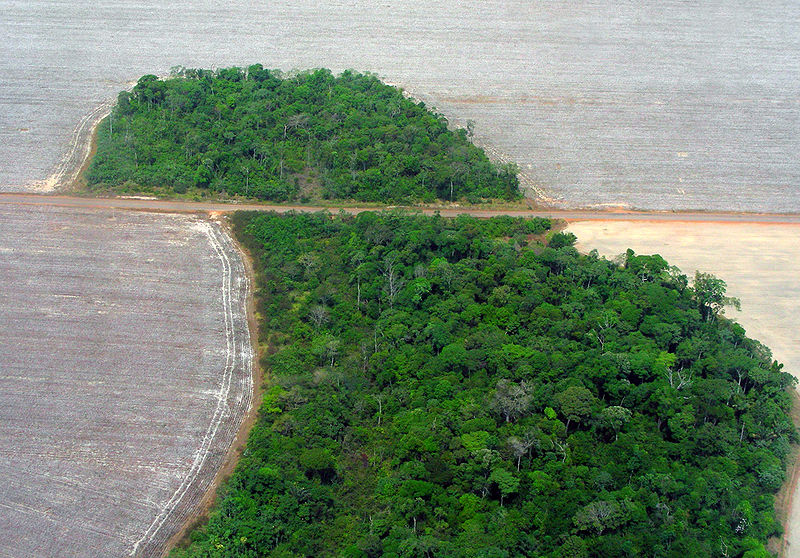
Nearly two-thirds of the Amazon rainforest is located in Brazil, making it the biggest component in the region’s deforestation rate.
Nearly two-thirds of the Amazon rainforest is located in Brazil, making it the biggest component in the region’s deforestation rate. Helpfully, Brazil also has the best systems for tracking deforestation, with the government and Imazon, a national civil society organization, releasing updates on a quarterly and monthly basis using MODIS satellite data, respectively. Both the Brazilian government and Imazon release more accurate data on an annual basis using higher resolution Landsat satellite imagery.
For other Amazon countries — primarily Colombia, Ecuador, Peru, and Bolivia since Venezuela, Suriname, Guyana and French Guiana are mostly outside the true Amazon basin watershed — the most reliable source for regular updates is Global Forest Watch, a platform that aggregates data from a many different sources. Currently Global Forest Watch has FORMA, a near-real-time forest cover monitoring system that also uses MODIS, and annual estimate made by a group of researchers led by a team at the University of Maryland.
Variance in monthly deforestation
Month-to-month deforestation is highly variable leading to frequent misreporting in the media. Both MODIS and Landsat cannot penetrate cloud cover, so during the rainy season — from roughly November to April — estimates are notoriously unreliable when compared to the same month a year earlier. Furthermore, most forest clearing in the Amazon occurs when it is dry. So if the dry season is early, deforestation may increase earlier than normal. For these reasons, the most accurate deforestation comparisons are made year-on-year. For Brazil, the deforestation “year” ends July 31: the peak of the dry season when the largest extent of forest is typically visible via satellite.
Nonetheless, short-term MODIS data isn’t useless — it can provide insights on trends, especially over longer periods of time. Generally, comparing 12 consecutive months of MODIS data will provide a pretty good indication of deforestation relative to other years. Therefore the charts below include a history of MODIS-based data as well as the longer-term Landsat-based data. The MODIS system used by Brazil’s National Institute for Space Research (INPE) is called DETER, while Imazon’s system is called SAD. INPE’s annual Landsat-based system is called PRODES.
Current monthly deforestation data for the Brazilian Amazon
INPE and DETER are used primary for law enforcement since detection occurs on roughly a biweekly basis, enabling environmental police to take action as large-scale forest clearing occurs. The Brazilian government has cited “law enforcement” as the reason it has switched to quarterly public releases of data, asserting that more frequent releases could undermine the effectiveness of taking action against illegal tree-felling.

INPE’s DETER vs. Imazon’s SAD data since April 2007, including the 12-month moving averages for both. Click to enlarge

INPE’s DETER vs. Imazon’s SAD data since January 2010, including the 12-month moving averages for both. Click to enlarge
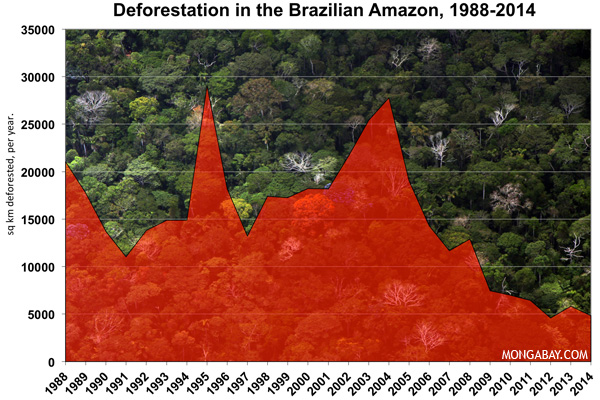
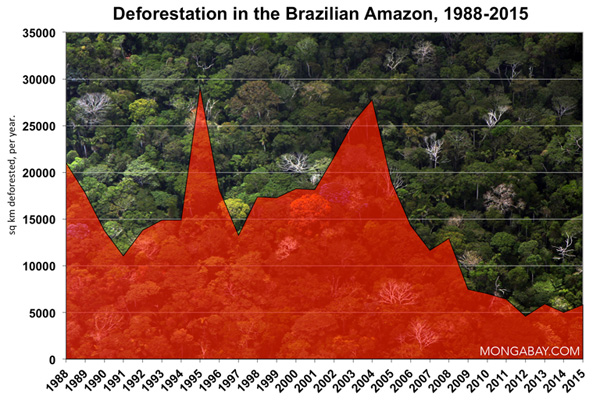
Current annual deforestation data for the Brazilian Amazon
PRODES data from INPE based on a year that runs from August 1-July 31.

Accumulated deforestation by state in the Brazilian Amazon, 1988 to present, using INPE PRODES data. Click to enlarge

Annual share of deforestation by state in the Brazilian Amazon, 1988 to present, using INPE PRODES data. Click to enlarge
Current annual deforestation data outside the Brazilian Amazon
The following charts are based on 2015 data from researchers led by the University of Maryland’s Matt Hansen. The “year” is January through December, rather than the August 1-July 31 year used for Brazil in the charts above.


– This report was originally published in Mongabay and is republished by an agreement to share content.