
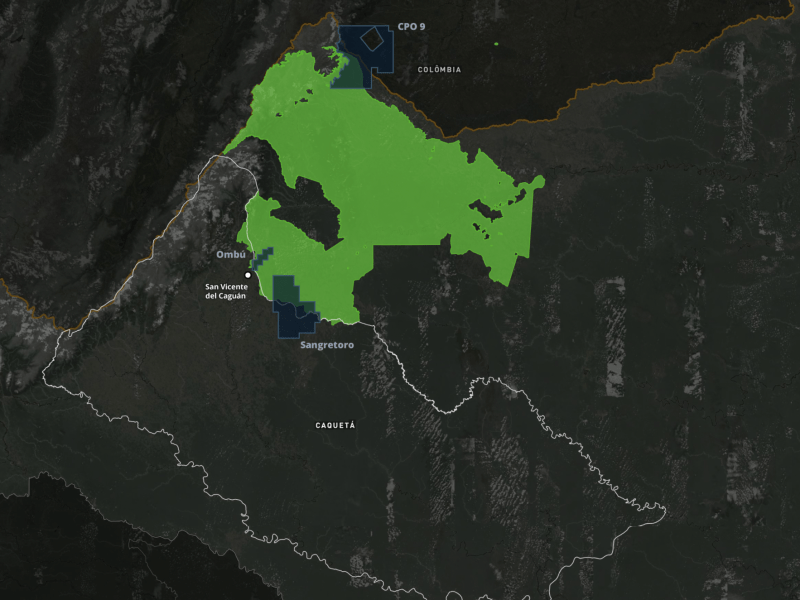
Visualizations highlighting oil exploration blocks in Colombia overlapping the AMEM environmental protected area.
Post Type Archives: Story Map
JEO Story Map
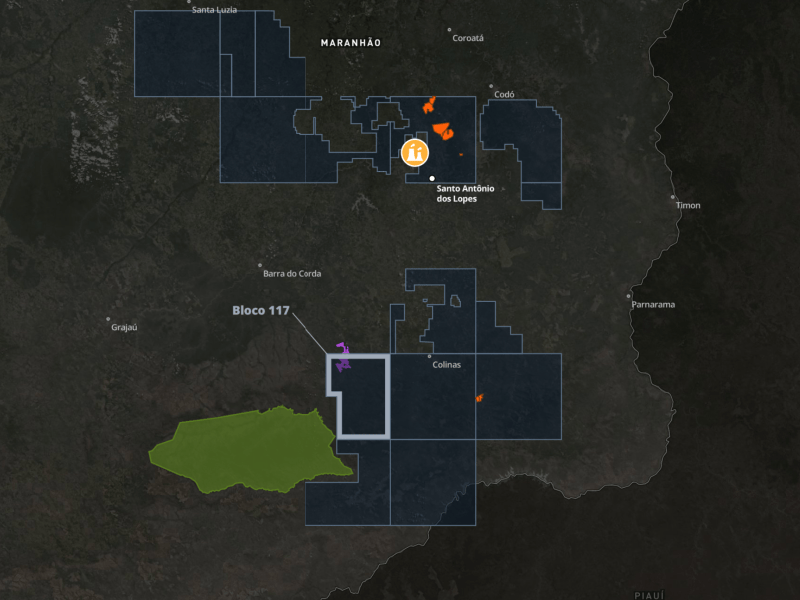
Oil ecocide – Parnaíba
Visualizations of the Parnaíba Thermoelectric Complex, showing the blocks that supply it with oil and gas exploration and production, and its overlap with protected areas, especially Block 117.
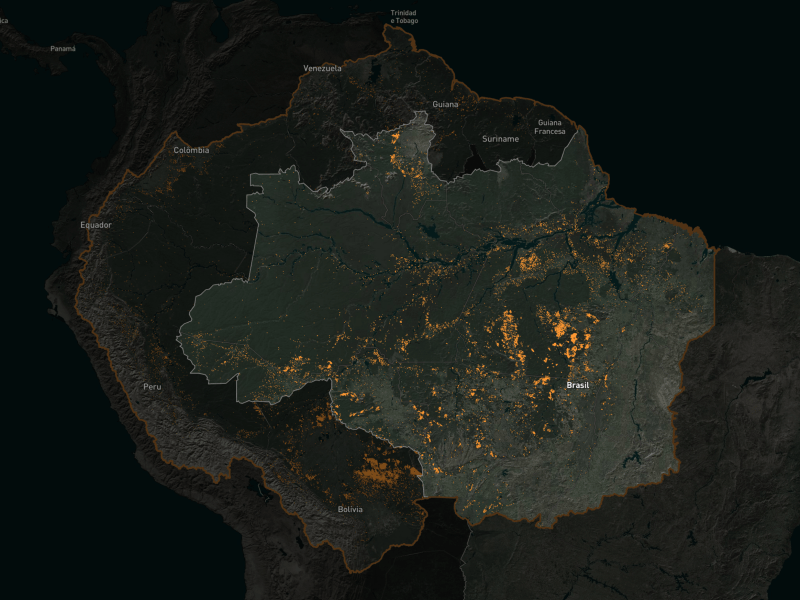
Tree Cover Loss in the Amazon
Maps showing different scenarios of native tree conver loss in the Pan-Amazon, from 2002 up to 2024, and their relationship with protected areas and agricultural expansion.

Primates: saimiri vanzolinii
Visualizations of the distribution of the Black Squirrel Monkey species, located in the Brazilian Amazon, and analyses of possible future scenarios regarding the species’ survival in the face of climate change.

Every Last Drop – Colombia
Maps showing data on oil exploration in the Colombian Amazon and their implications for protected environmental areas, such as Indigenous communities and the contamination of the Putumayo River waters.

Every Last Drop – Guyana
Maps showing oil data in Guyana, one of the largest oil-exporting countries in Latin America, and the contradictions of its production with the current conditions of the population.

Every Last Drop – Global reserves
Maps with global data and the potential for expansion of blocks in the Amazon compared to the rest of South America, including encroachment on protected areas.

Every Last Drop – gas flaring in the Amazon
Maps with locations of flaring (natural gas burning) in the Pan-Amazon and the impact on health in the respective affected countries.

Every Last Drop – Environmental Oil Sensitivity Charts
Maps highlighting the risk of oil spills in the Foz do Amazonas Basin, threatening local biodiversity and oil-sensitive natural areas.

Every Last Drop – Exploration on the Brazilian Equatorial Margin
Maps highlighting oil exploration data on the Brazilian equatorial margin, and the implications of this on environmentally sensitive and protected areas.