In order to track trade routes from specific production regions to specific consumer markets, project have developed a prediction algorithm they call the SEI-PCS model, which stands for Spatially Explicit Information on Production to Consumption Systems.

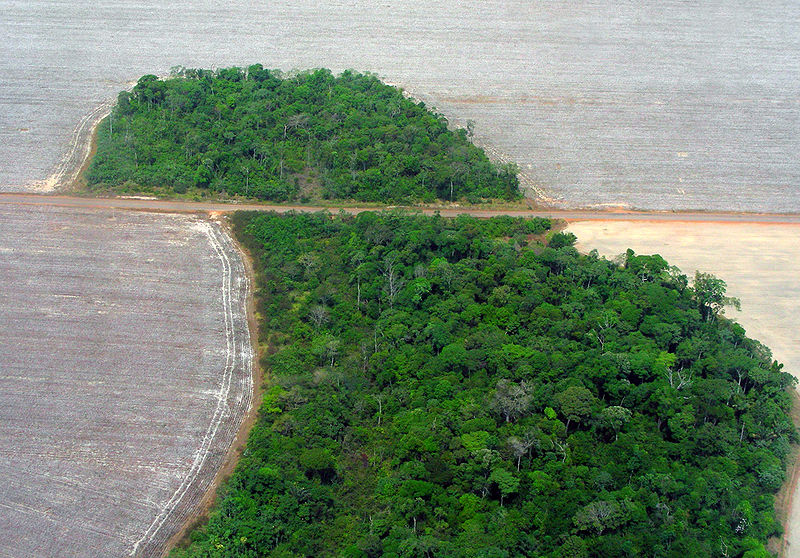
Rainforest fragments in a sea of soyfields in Mato Grosso, Brazil. Photo by Rhett A. Butler.
Sitting down at my favorite restaurant I decide to order a stir-fry loaded up with fresh vegetables and noodles. Choosing the more eco-friendly route, I opt for soy in my food, rather than an animal-based protein. I feel pretty good about how healthy I’m being, but I know I could do better. I scour the menu for some idea of where my food is coming from, and finally end up asking the waiter. He immediately gets flustered and contacts his manager, while I try in vain to assure him that I’m merely curious and not really being critical of the restaurant or his service in any way.
It is an exercise in frustration. As I look around me, I know that the fish, meat, vegetables or starch on the many plates around me could come from Indonesia or Guyana, but none of us knows.
As battles over labeling genetically modified foods or displaying calorific breakdowns per serving rage on, it appears that a possibly more significant battle is in its infancy – where do all the ingredients on the package actually come from?
Today, as the onset of winter barely changes what people in North America eat due to large-scale importation of produce from sunnier climes, scientists are pushing beyond simple single-stop trade route analyses to get to the meat of the problem.
“Current methods linking production impacts to final consumption typically trace the origin of products back to the country level, lacking fine-scale spatial resolution,” reports Javier Godar, along with U. Martin Persson,
E. Jorge Tizado and Patrick Meyfroidt, in their recent paper in the journal Ecological Economics.
“This hampers accurate calculation of trade and consumption footprints,” state the authors, who hail from research institutes across Belgium, Spain and Sweden. This is particularly so for countries in which socio-environmental conditions vary greatly from one region to the next.

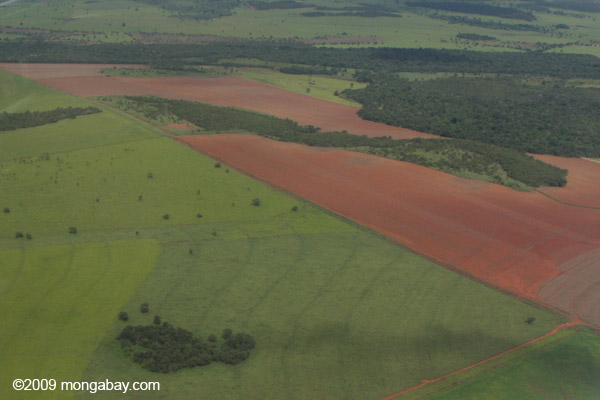
Soy fields in the southern Amazon. Photo by Rhett A. Butler.
In order to track trade routes from specific production regions to specific consumer markets, Godar and colleagues have developed a prediction algorithm they call the SEI-PCS model, which stands for Spatially Explicit Information on Production to Consumption Systems.
“[Current models] remain highly aggregated, relying on country-to-country trade data and national production data, and assume that the socio-environmental impacts associated with production of a given commodity are homogenous within each producer country,” the authors write. This can lead to erroneous conclusions that can have widespread impacts on trade and conservation.
The authors cite the example of a country importing Argentinean soy primarily from the Pampa region, which was almost fully farmland decades ago. Naturally, it would have a less significant land footprint than another country importing the same amount of soy from the Chaco region of Argentina, where not only are soybean yields only half that of the Pampa, but deforestation to claim farmland for soy is high.
Before one is tempted to write off the Chaco entirely, however, one must consider some confounding factors. For example, agriculture in the Pampa causes higher nutrient runoff due to nearly completely depleted soil stocks – a factor in favor of importing from the Chaco.
“These distinctions would be masked by conventional country-to-country trade footprint analyses,” the authors point out, as they describe their new method of simulating trade impacts.
The SEI-PCS depends on a range of data, such as information on sub-national production, distribution of domestic demand, and import and export data. If such data are available, at fine-enough geographic scales, the model produces startling results to problems we thought we already had the answers to.
Take the case of Brazilian soy consumption by Japan, China, the US, the EU, Nordic countries, and Brazil itself, among others. A detailed analysis revealed that while China has increased its consumption of soy dramatically (from 3.87 million tons (Mt) in 2001 to 24.69 Mt by 2011, a rise of 639 percent), its sources have remained relatively stable and focused in the Cerrado and Atlantic forests.
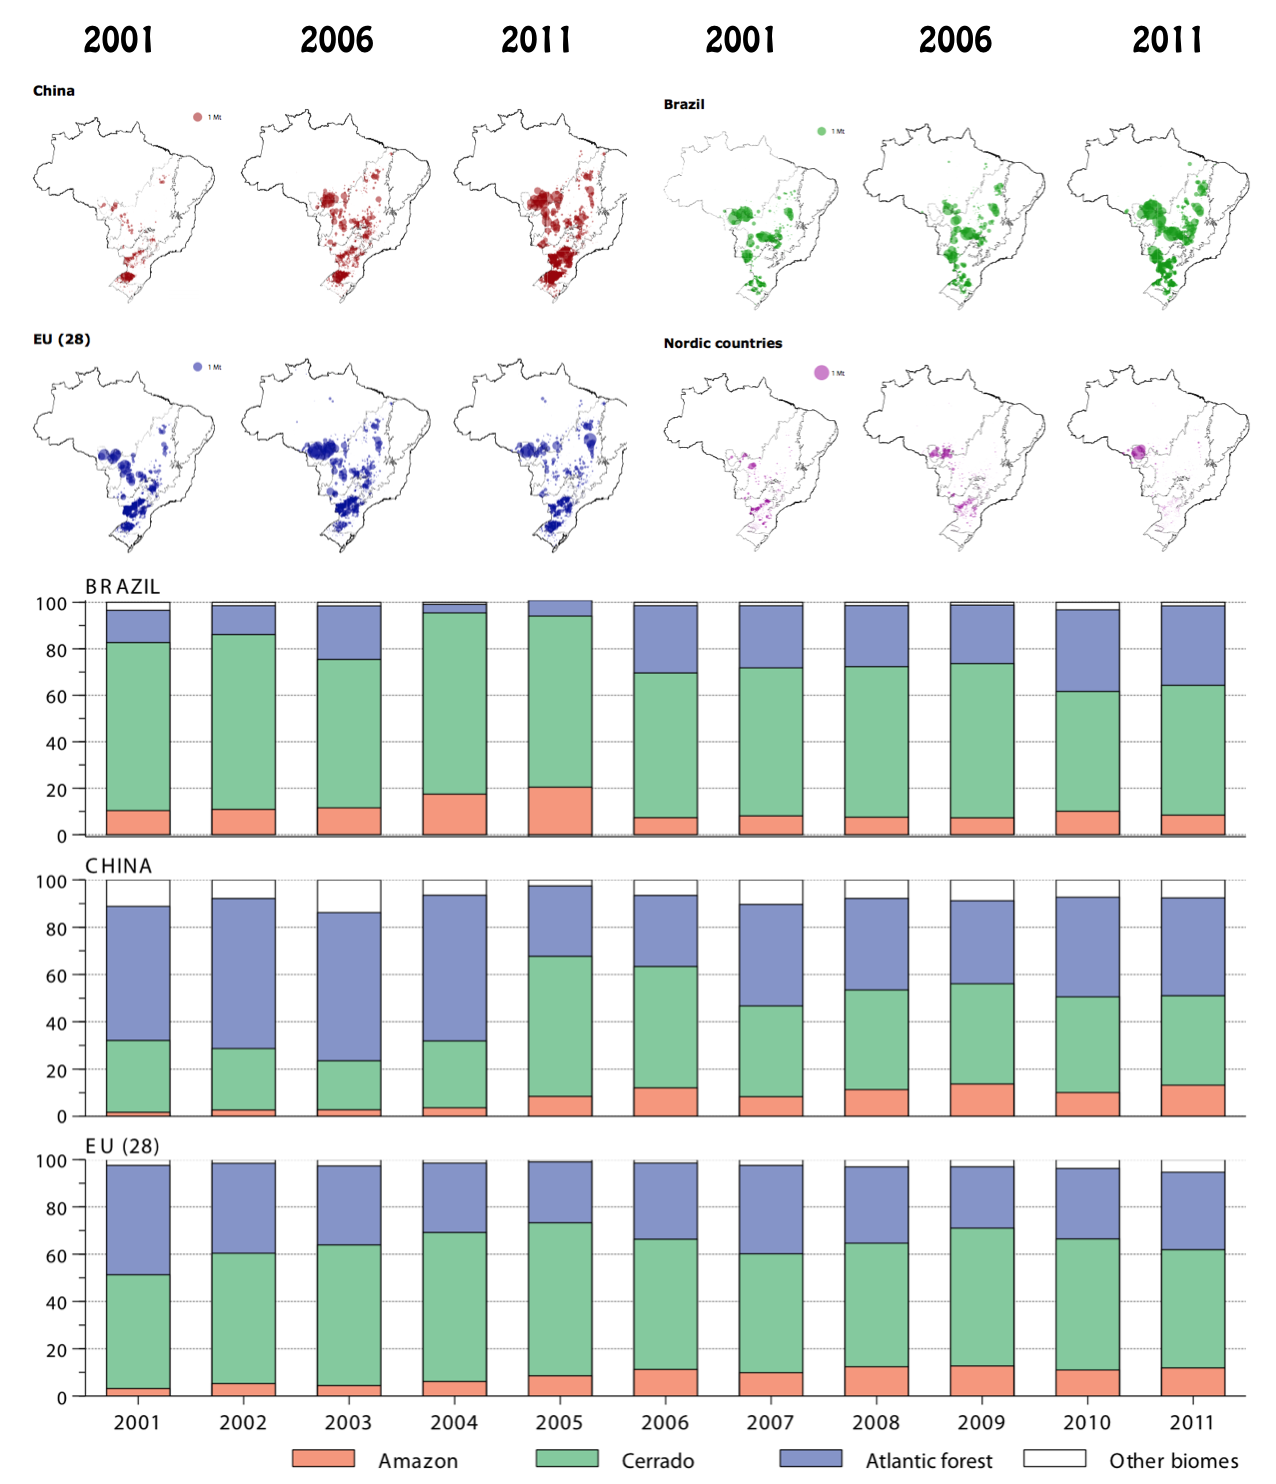
Modified from Figs 1 and 4 from Godar et al., 2015. The maps depict the production of soy across Brazil in millions of tons at three time points (2001, 2006, and 2011) for major consumer countries. Below is a time series of the proportion of Brazilian soy consumption of China, the EU and Brazil that comes from the three main Brazilian biomes.
However, the EU, which technically reduced its soy consumption by around 3 Mt from 2001 to 2011, gets nearly all its soy from within the Amazonian biome: 65.4 percent of exported soy produced in Pará, 81.3 percent in Rondonia and 50.4 percent in Roraima, all Amazonian biome states. Click to enlarge.
Nevertheless, the authors contend we cannot consider the EU responsible for all of the deforestation associated with soy production in the Amazonian biome. This is because the single state of Mato Grosso, evenly split geographically between the Amazonian and Cerrado biomes, is responsible for 90.8 percent of soy production for the entire Amazonian biome. So in the end, China consumes 39.8 percent of Amazonian-produced soy, almost as much as Brazil and the EU together.
Most remarkably, as Godar and colleagues crunched the numbers, they found that Brazil itself had significantly increased its consumption of soy from all biomes, particularly the Cerrado and south Atlantic forests.
In fact, Brazil was the largest consumer of Brazilian soy in 2011.
Global Forest Watch (GFW) is a subsidiary of the World Resources Institute and monitors forest loss through on-the-ground reports and satellite imagery across the globe. Data from GFW shows forest cover in the three Brazilian biomes – the Cerrado, the Atlantic Forest, and the Amazon – has decreased over the last decade. However, recent reforms may be helping to lessen Brazil’s rate of deforestation.

Tree cover loss data on one Brazilian state in each biome – (from left to right) Espirito Santo in the Atlantic Forest Biome, Goiás in the Cerrado, and Pará in the Amazon biome – overlayed over population density maps. The graphs at the top show yearly tree cover loss from 2001 through 2012, as well as overall forest cover, with exact tree cover loss for 2001-2012 in total given below. Click to enlarge.
The authors note that the Cerrado biome has supported increased demand by nearly all consumer countries (except the EU), implying that the growing demand for soy, both within the country and internationally, has been largely supported by expansion in the Cerrado.
Finally, although China’s increased demand in absolute terms has been met largely from the Cerrado and Atlantic Forest biomes, the Amazonian biome has suffered the largest rate of increase due to demands from China for soy.
These perspectives add a new, revealing and ultimately useful layer of complexity to soy trade routes. The SEI-PCS model has also demonstrated that it could be effective in other contexts, given sufficiently accurate inputs.
In order to make educated choices about the true impacts of their consumption, it is becoming increasingly necessary for many consumers to be able to trace their food to specific regions of the world. “Consume less!” might have been a good mantra in the past, but in today’s highly globalized environment where, as Friedman would say, the earth is becoming flatter each year, determining clear trade routes is as important for governments to track consumption as it is for you and I to choose what to order at a favorite restaurant.
– This report was originally published in Mongabay and is republished by an agreement to share content.