MAAP shows two additional types of satellites imagery (due to lack of new high-resolution image) indicating that the illegal gold mining deforestation continues to penetrate deeper into the Reserve.
In MAAP #21, we revealed, using high-resolution images, the first sign of an invasion into the Tambopata National Reserve (an important natural protected area in the southern Peruvian Amazon) by illegal gold mining activities. Here in MAAP #24, we show two additional types of satellites imagery (due to lack of new high-resolution image) indicating that the illegal gold mining deforestation continues to penetrate deeper into the Reserve.

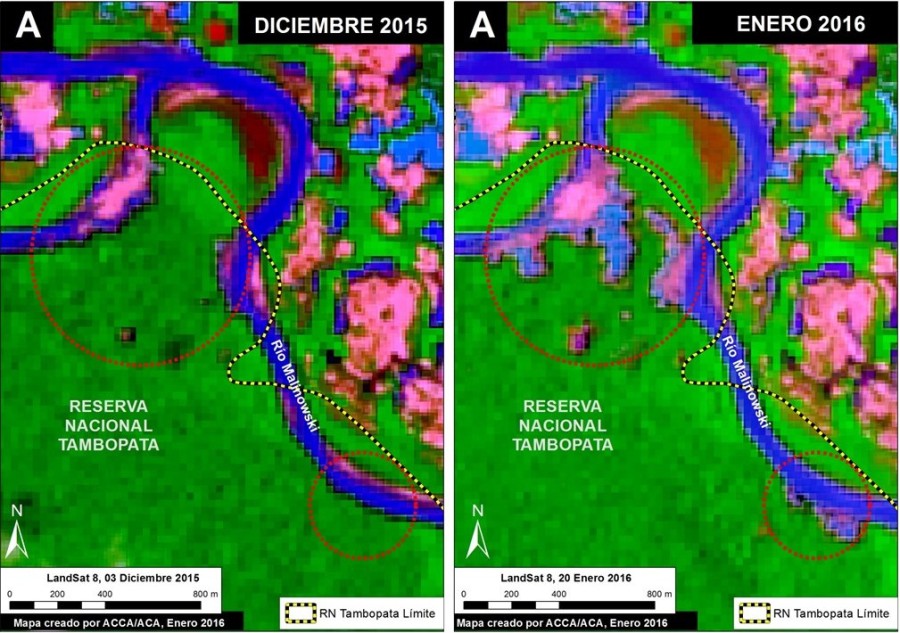
Image 24a. Landsat images showing the expansion of deforestation inside the Tambopata National Reserve between December 2015 (left panel) and January 2016 (right panel). Data: USGS, SERNANP.
Image 24a shows a comparison between two Landsat images (30 m resolution) indicating that the deforestation continued to increase within the Reserve between December 2015 (left panel) and January 2016 (right panel). The red circles indicate the general location of the newly deforested areas, which appear pink (soil without forest cover) and blue (wastewater pools) in contrast to the green (standing forest). The deforestation inside the Tambopata National Reserve between December 2015 and January 2016 is approximately 20 hectares (49 acres).
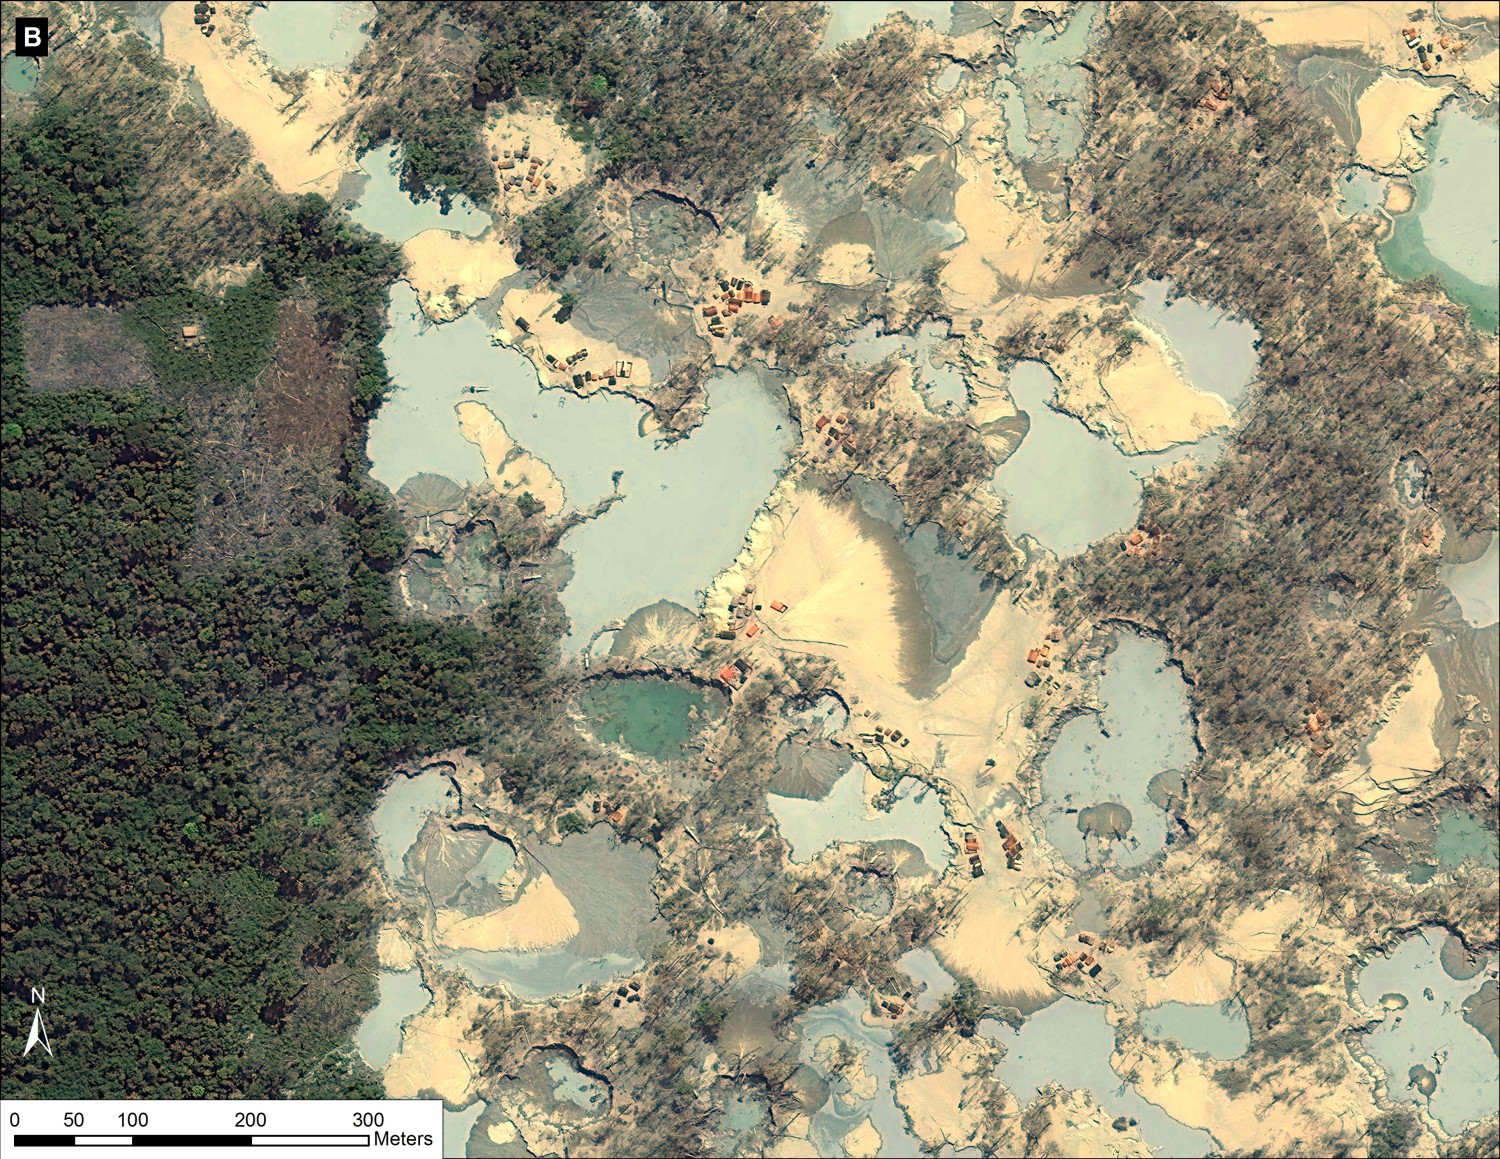
Image 24b is the base map showing the area described above in a larger context. The red inset box indicates the area shown in Image 24a.

Image 24b. Reference Map of mining area. Data: SERNANP, WorldView-2 of Digital Globe (NextView).
Radar: Powerful New Tool

Image 24c. Radar images showing the expansion of deforestation inside the Tambopata National Reserve between November 2015 (left panel) and January 2016 (right panel) Data: SERNANP, Sentinel-1
Image 24c shows, for the first time in MAAP, information from a radar satellite (Sentinel-1 from the European Space Agency). Unlike multi-spectral Landsat imagery that is vulnerable to clouds blocking the view, radar imagery is useful year-round (even the Amazon rainy season) because it can penetrate through cloud cover. In the displayed images, the shades of gray are related to the topography and the height of the forest. Lower areas, such as recently deforested lands and bodies of water, appear darker (almost black) in color, while higher areas such as standing forests appear lighter in color. Image 24c confirms the increase in deforestation between November 2015 (left panel) and January 2016 (right panel) within the area indicated above (see the red boxes).
– This report was originally published in MAAP and is republished by an agreement to share content.