Why we decided to make this map
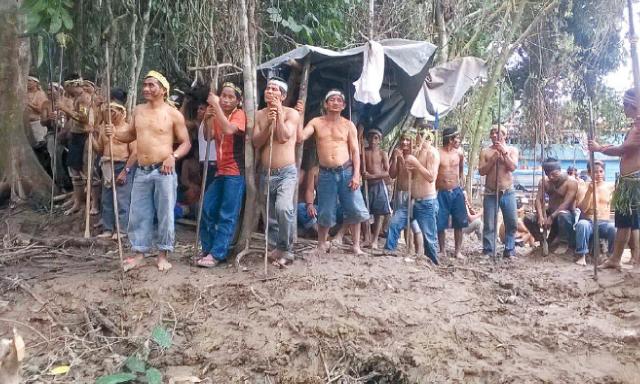
Fires in the Amazon, both purposefully and accidentally started by people, along with naturally occurring fires, are a serious problem with implications for global climate change.[:]
Many environmentalists are relieved about the decreased rate of deforestation in the Amazon, but deforestation is only one of many pressures that the “lungs of the earth” must endure. A Lancaster University study has shown that fires in the Amazon causes stored carbon to be lost into the atmosphere. Meanwhile, researchers at Penn State found that fires and drought are a deadly combination for Amazon trees.
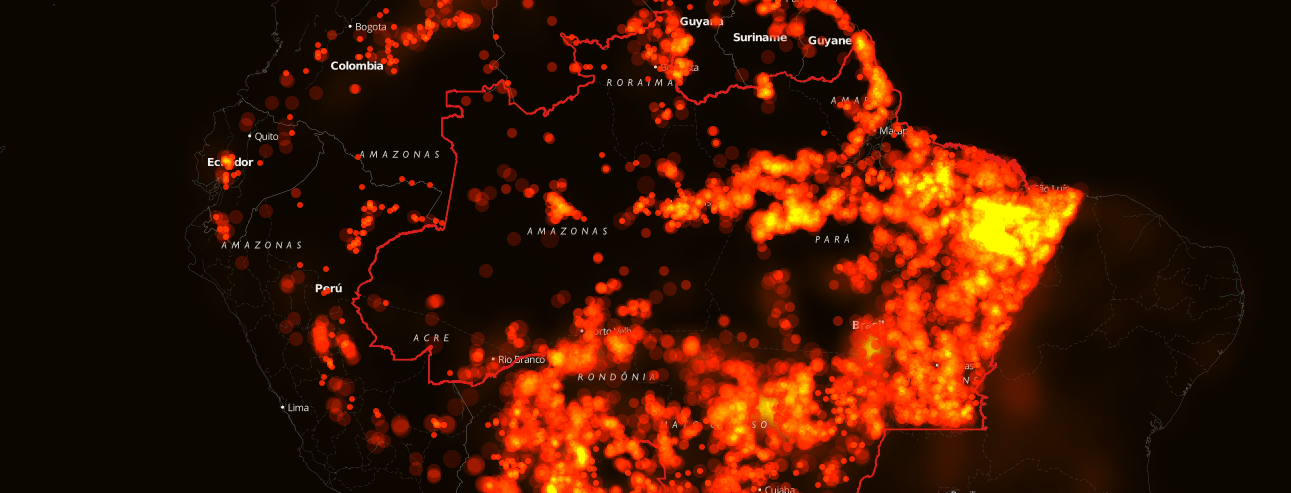
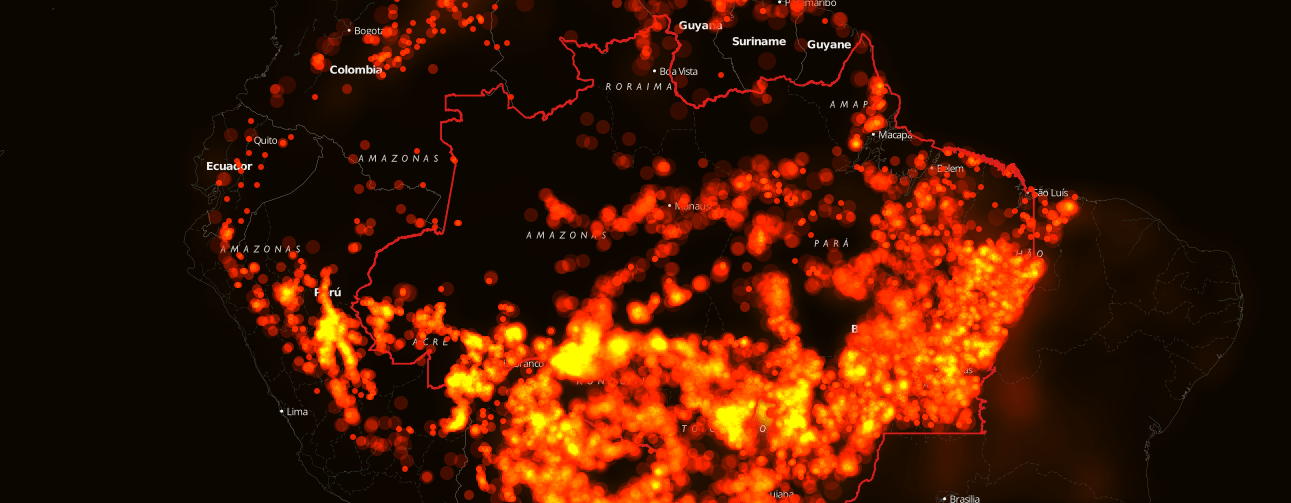
The Fires in the Amazon map puts two years worth of forest fires into perspective. You can watch the fires raging during the dry season, and you can see which areas suffer from fires year-round. The map makes it clear that fires are no small issue.
Data
The data came from NASA’s FIRMS (Fire Information for Resource Management System), a part of EOSDIS (Earth Observing Observing System Data and Information System). NASA’s FIRMS has worldwide information on fires freely available for download from the year 2000 to the present in shapefile or comma-separated text format.
Process
Using CartoDB made creating this map a simple process. The first step was to create a table using the CartoDB dashboard and upload the data in geoJson format. The date column’s type had to be redefined as “date”, which was simple to do in Data View by selecting the column and then “Change Data Type”.
For the baselayer, a custom Mapbox layer with a heatmap of fire density was added quickly using the map’s id.
I wanted the data visualization to mimic the movement of a fire as it grows and sputters, and so, using the visualization wizard, I chose the ‘Torque’ animated visualization, chose the “date” column to visualize the data over time, and played with the blend mode and trails to get the effect I wanted. Finally, we inserted a custom HTML legend, and we were done!
Final Result
Here you can see our final result on InfoAmazonia.